Collector
Any number of collector processes can run simultaneously. They handshake with each other and for a Raft cluster, and elect one process as a leader.
All processes convert all snmp traps received by the system they’re running on into json documents and publish these to the RabbitMQ dashboard.collection exchange.
The collector processes add their Raft state (either leader, candidate or follower) the trap message.
Execution
A collector process is started by executing the trap-forwarder shell script :
Usage: trap-forwarder [OPTIONS]

Options:
  --staging PATH      Trap staging directory  [required]
  --hostname TEXT     RabbitMQ hostname ["['test-dashboard-
                      storage01.geant.org', 'test-dashboard-
                      storage02.geant.org', 'test-dashboard-
                      storage03.geant.org']"]

  --collection TEXT   Exchange name ['dashboard.collection']
  --requests TEXT     monitoring requests exchange name ['mon.requests']
  --username TEXT     RabbitMQ username ['dashboard']
  --password TEXT     RabbitMQ user password ['password']
  --vhost TEXT        RabbitMQ vhost ['/dashboard']
  --watchdog INTEGER  watchdog check frequency in seconds (no watchdog if
                      unset)

  --timeout INTEGER   number of seconds without traps to indicate error
  --help              Show this message and exit.
Archiver
Any number of archiver processes can run simultaneously. All listen directly to the RabbitMQ dashboard.archivers worker queue and process traps in parallel, writing each to an elastic search index.
The index_prefix is diversified by appending the date string to derive the actual index name used.
Execution
An archiver process is started by executing the archiver shell script:
Usage: archiver [OPTIONS]

Options:
  --rmq_hostname TEXT     RabbitMQ hostname ["['test-dashboard-
                          storage01.geant.org', 'test-dashboard-
                          storage02.geant.org', 'test-dashboard-
                          storage03.geant.org']"]

  --es_hostname TEXT      Elasticsearch hostname [test-db-elk.geant.org]
  --es_index_prefix TEXT  Elasticsearch index name prefix [traps-]
  --es_doctype TEXT       Elasticsearch doc type [trap]
  --collection TEXT       collection pub/sub exchange name
                          ['dashboard.collection']

  --archivers TEXT        archiver worker ueue name
                          ['dashboard.archivers']
  --monitoring TEXT       monitoring requests exchange name
                          ['mon.requests']
  --username TEXT         RabbitMQ username ['dashboard']
  --password TEXT         RabbitMQ user password ['password']
  --vhost TEXT            RabbitMQ vhost ['/dashboard']
  --username TEXT         RabbitMQ username ['dashboard']
  --password TEXT         RabbitMQ user password ['password']
  --vhost TEXT            RabbitMQ vhost ['/dashboard']
  --watchdog INTEGER      watchdog check frequency in seconds
                          (no watchdog if unset)

  --timeout INTEGER       number of seconds without traps to indicate error
  --help                  Show this message and exit.
Classifier
Any number of classifier processes can run simultaneously. All listen directly to the RabbitMQ dashboard.classifiers worker queue and process traps in parallel, enriching them with Inventory Provider data and republishing them to the dashboard.classified exchange.
Only traps with collector.raft == leader are processed. All others are discarded.
Execution
A classifier process is started by executing the classifier-worker shell script:
Usage: classifier-worker [OPTIONS]

Options:
  --hostname TEXT         RabbitMQ hostname [['test-dashboard-
                          storage01.geant.org', 'test-dashboard-
                          storage02.geant.org', 'test-dashboard-
                          storage03.geant.org']]

  --monitoring TEXT       monitoring requests exchange name [mon.requests]
  --collection TEXT       collection pub/sub exchange name
                          [dashboard.collection]

  --classifiers TEXT      global classifiers queue name
                          [dashboard.classifiers]
  --classified TEXT       classified pub/sub exchange name
                          [dashboard.classified]

  --username TEXT         RabbitMQ username ["dashboard"]
  --password TEXT         RabbitMQ user password ["password"]
  --vhost TEXT            RabbitMQ vhost ["/dashboard"]
  --inventory TEXT        inventory provider uri ["http://test-inventory-
                          provider01.geant.org:8080"]

  --watchdog INTEGER      watchdog check frequency in seconds (no watchdog if
                          unset)

  --timeout INTEGER       number of seconds without traps to indicate error
  --ignored-agent TEXT    ignored snmp agent hostnames
  --inventory_token TEXT  API Token for accessing the Inventory Provider service
                          [default is None]
  --help                  Show this message and exit.
NREN Isolation
Any number of nren isolation checker processes can run simultaneously. They handshake with each other and for a Raft cluster, and elect one process as a leader.
All processes listen for bgp session traps
Usage: nren-isolation-checker [OPTIONS]
- Options:
- --hostname TEXT
RabbitMQ hostname [‘test-dashboard- storage01.geant.org’, ‘test-dashboard- storage02.geant.org’, ‘test-dashboard- storage03.geant.org’]
- --monitoring TEXT
monitoring requests exchange name [mon.requests]
- --correlator TEXT
alarm state broadcast exchange name [dashboard.alarms.broadcast]
- --isolation TEXT
isolation listener worker queue name [dashboard.isolation]
- --broadcast TEXT
isolation state broadcast exchange name [dashboard.isolation.broadcast]
- --username TEXT
RabbitMQ username [dashboard]
- --password TEXT
RabbitMQ user password [password]
- --vhost TEXT
RabbitMQ vhost [/dashboard]
- --watchdog INTEGER
watchdog check frequency in seconds (no watchdog if unset)
- --timeout INTEGER
number of seconds without correlator state messages to indicate error [240]
- –timeout_reconnect/–no-timeout_reconnect
reconnect to rmq if no traps received in ‘timeout’ seconds [True]
- --email_host TEXT
Email server hostname [prod-mail.geant.net]
- --email_port INTEGER
Email server port [25]
- --email_from TEXT
from address for messages to the TT system [alarm@geant.org]
- --email_to TEXT
Email recipient address(es) for TT messages [required]
- --email_username TEXT
Email authentication username [None]
- --email_password TEXT
Email authentication password [None]
- --isogroup TEXT
Additional groups to include in the isolation decision
- --nren TEXT
Additional/updated nren groups to include (format: INT:STRING)
- --inventory TEXT
Inventory Provider base uris [’https://test-inprov01.geant.org/’, ‘https://test-inprov02.geant.org/’]
- --cache_hostname TEXT
Cache db hostname [test-dashboard- storage03.geant.org]
- --cache_dbport INTEGER
Cache db hostname [3306]
- --cache_username TEXT
Cache db username [dbcache]
- --cache_password TEXT
Cache db username [cache-secret]
- --cache_dbname TEXT
Cache db name [services_cache]
- --inventory_token TEXT
API Token for accessing the Inventory Provider service [default is None]
- --help
Show this message and exit.
The default list of groups that are used to identify isolation mappings is below. This list can be extended with the –isogroup option.
DEFAULT_ACCESS_GROUP_NAMES[
"eGEANT"
]
Active Correlator Endpoint State Checker
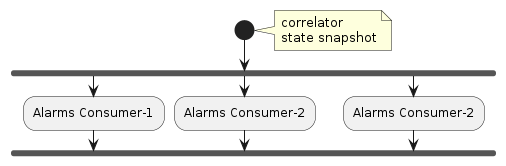
Any number of active endpoint state checker processes can run simultaneously. They all listen for correlator alarm state broadcast messages, and then distribute the active endpoints across all processes and perform the active state checks. If any worker finds a particular endpoint to be up it notifies the correlator.
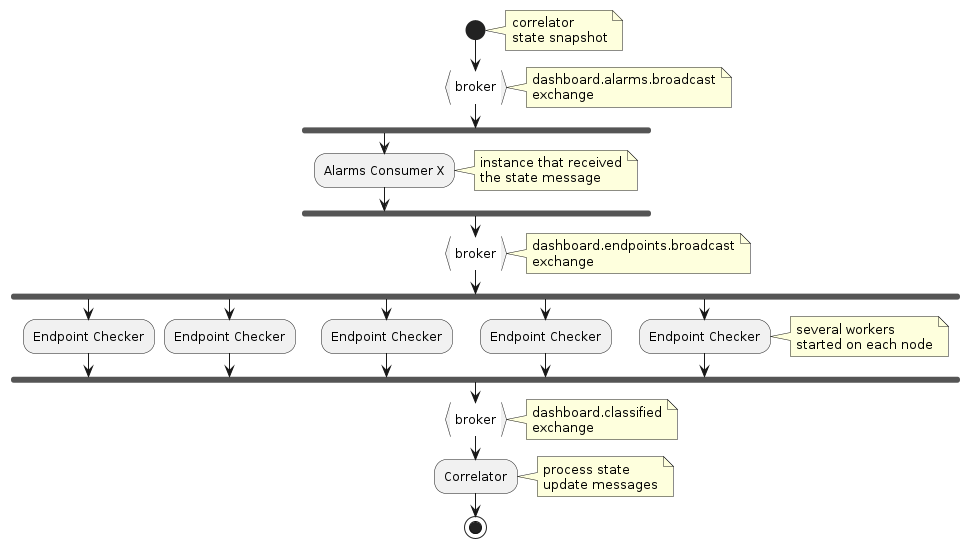
Data Flow

Next Data Flow Design …

Remote Collector
Any number of remote collector processes can run simultaneously. They all subscribe to a named queue on the live RabbitMQ cluster and forward traps to the collection exchange on the staging cluster.
Execution
A collector process is started by executing the remote-collector shell script :
Usage: remote-collector [OPTIONS]

Options:
  --source-rmq TEXT          Broker hostname of a member of the live RabbitMQ
                             cluster ['test-dashboard-storage01.geant.org',
                             'test-dashboard-storage02.geant.org',
                             'test-dashboard-storage03.geant.org']
  --source-exchange TEXT     Pub/Sub exchange name used for subscribing to
                             live traps [dashboard.collection]
  --subscription-queue TEXT  Queue name to use for subscribing to remote traps
                             [dashboard.remote.collection]
  --source-username TEXT     RabbitMQ username [dashboard]
  --source-password TEXT     RabbitMQ user password [password]
  --source-vhost TEXT        RabbitMQ vhost [/dashboard]
  --dest-rmq TEXT            Broker hostname of a member of the staging
                             RabbitMQ cluster ['test-noc-alarms-vm01.geant.org',
                             'test-noc-alarms-vm02.geant.org',
                             'test-noc-alarms-vm03.geant.org']
  --dest-exchange TEXT       Pub/Sub exchange on the staging cluster for
                             republishing traps [copied from src-exchange]
  --dest-username TEXT       RabbitMQ username [copied from src-exchange]
  --dest-password TEXT       RabbitMQ user password [copied from src-exchange]
  --dest-vhost TEXT          RabbitMQ vhost [copied from src-exchange]
  --watchdog INTEGER         watchdog check frequency in seconds (no watchdog if unset)
  --timeout INTEGER          number of seconds without traps to indicate error [60]
  --help                     Show this message and exit.
TTS Notifier
Any number of tts-notifier processes can run simultaneously. All listen directly to the RabbitMQ dashboard.notifiers.tts worker queue and process alarm messages in parallel. This implementation is used for sending email messages containing information about alarms in a format that can be parsed according to the existing OTRS configuration.
Not all messages received from the queue result
in an email message being sent: the
method should_create_ticket()
determines this.
Execution
A tts-notifier process is started by executing the tts_notifier shell script:
Usage: tts_notifier [OPTIONS]

Options:
  --hostname TEXT                 RabbitMQ hostname ["['test-dashboard-
                                  storage01.geant.org', 'test-dashboard-
                                  storage02.geant.org', 'test-dashboard-
                                  storage03.geant.org']"]

  --monitoring TEXT               monitoring requests exchange name
                                  ['mon.requests']

  --notifications TEXT            external notifications pub/sub
                                  exchange name
                                  ['dashboard.external.notifications']

  --notifier TEXT                 notifier worker queue name
                                  ['dashboard.notifiers.tts']

  --username TEXT                 RabbitMQ username ['dashboard']
  --password TEXT                 RabbitMQ user password ['password']
  --vhost TEXT                    RabbitMQ vhost ['/dashboard']
  --email_host TEXT               Email host ['prod-mail.geant.net']
  --email_port INTEGER            Email host port [25]
  --standard_email_sent_from TEXT
                                  Standard from address for messages
                                  to the TT system ['alarm@geant.org']

  --gts_email_sent_from TEXT      GTS from address for messages to the TT
                                  system ['alarm+gts@geant.org']

  --eumetsat_email_sent_from TEXT
                                  EUMETSAT from address for messages to the
                                TT system ['alarm+eumetsat@geant.org']

  --email_to TEXT                 Email recipient address(es) for
                                  TT messages [required]

  --email_username TEXT           Email authentication username
  --email_password TEXT           Email authentication password
  --help                          Show this message and exit.
API
- dashboard.notifications.common.should_create_ticket(notification_message)
Business logic for deciding if a tts ticket should be created.
Namely:
only send email for finalized & critical alarms
don’t an email if one has already been sent
don’t send an email for short-lived alarms
- Parameters:
notification_message – the dict containing alarm info
- Returns:
true iff a ticket should be created
- dashboard.notifications.tts_notifier.handle_message(message, smtp_params)
- dashboard.notifications.tts_notifier.send_message(message, smtp_params)
OTRS Notifier
Any number of otrs-notifier processes can run simultaneously. All listen directly to the RabbitMQ dashboard.notifiers.otrs worker queue and process alarm messages in parallel. This implementation is used for sending messages containing information about alarms to the OTRS API in a format that can be parsed according to the existing OTRS configuration.
Not all messages received from the queue result
in a message being sent: the
method should_create_ticket()
determines this.
Execution
A otrs-notifier process is started by executing the otrs_notifier shell script:
Usage: otrs_notifier [OPTIONS]

Options:
  --hostname TEXT                 RabbitMQ hostname  [required]
  --monitoring TEXT               monitoring requests exchange name
                                  [required]
  --notifications TEXT            external notifications pub/sub exchange name
                                  [required]
  --notifier TEXT                 notifier worker queue name  [required]
  --username TEXT                 RabbitMQ username  [required]
  --password TEXT                 RabbitMQ user password  [required]
  --vhost TEXT                    RabbitMQ vhost  [required]
  --otrs_username TEXT            OTRS username  [required]
  --otrs_pwd TEXT                 OTRS password  [required]
  --otrs_server_uri TEXT          OTRS server uri  [required]
  --otrs_queue TEXT               OTRS queue  [required]
  --otrs_maintenance_queue TEXT   OTRS Maintenance tickets queue
  --otrs_maintenance_state TEXT   OTRS States used to find active Maintenance
                                  tickets
  --customer_user TEXT            OTRS customer user  [required]
  --alarmsdb_hostname TEXT        Alarms db hostname  [required]
  --alarmsdb_port INTEGER         Alarms db port
  --alarmsdb_name TEXT            Alarms db name
  --alarmsdb_username TEXT        Alarms db username
  --alarmsdb_password TEXT        Alarms db user password
  --tts_cache_duration INTEGER    Number of seconds that TTS Maintenance
                                  tickets are cached for
  --include-sids / --no-include-sids
                                  Include SIDs in notification message [True]
  --field-values FILENAME         Path to file containing OTRS default field
                                  values  [required]
  --help                          Show this message and exit.
API
- dashboard.notifications.otrs_notifier.process_notification_message(message, otrs_config, include_sids)
Process a notification message
- Parameters:
message – dict containing notification message
otrs_config – Configuration for connecting to OTRS
tts_cache – cache for storing OTRS tickets
include_sids – whether to include SIDs in the details stored in OTRS
- Returns:
OTRS ticket Number
Slack Notifier
Any number of slack-notifier processes can run simultaneously. All listen directly to the RabbitMQ dashboard.notifiers.slack worker queue and process alarm messages in parallel. This implementation is used for publishing received alarm messages to Slack.
Execution
A slack-notifier process is started by executing the slack_notifier shell script:
Usage: slack_notifier [OPTIONS]

Options:
  --hostname TEXT       RabbitMQ hostname ["['test-dashboard-
                        storage01.geant.org', 'test-dashboard-
                        storage02.geant.org', 'test-dashboard-
                        storage03.geant.org']"]

  --monitoring TEXT     monitoring requests exchange name ['mon.requests']
  --notifications TEXT  external notifications pub/sub exchange name
                        ['dashboard.external.notifications']

  --notifier TEXT       notifier worker queue name
                        ['dashboard.notifiers.slack']

  --username TEXT       RabbitMQ username ['dashboard']
  --password TEXT       RabbitMQ user password ['password']
  --vhost TEXT          RabbitMQ vhost ['/dashboard']
  --slack_token TEXT    Slack token [...]

  --slack_channel TEXT  Slack channel ['dashboardv3']
  --help                Show this message and exit.
Notification Archiver
Any number of notification-archiver processes can run simultaneously. All listen directly to the RabbitMQ dashboard.notifiers.es_archiver worker queue and process alarm notifications sent to the dashboard.external.notifications exchange in parallel.
Each alarm notification is indexed to the Elasticsearch/Opensearch alarm-notifications index.
The notification-archiver process is configured via a JSON file formatted as follows:
_ARCHIVER_CONFIG_SCHEMA
The archive element of the above configuration file must be formatted as follows:
ALARM_NOTIFICATIONS_RMQ_CONFIG
Execution
A notification-archiver process is started by executing the notification-archiver shell script:
Usage: notification-archiver [OPTIONS]

Options:
  --config FILENAME  configuration filename  [required]
  --help             Show this message and exit.
State Archiver
Any number of state-archiver processes can run simultaneously. All consume messages (in round-robin fashion) sent by the correlator to the dashboard.alarms.broadcast exchange and by the isolation checker to the dashboard.isolation.broadcast exchange.
Each notification is indexed to the Elasticsearch/Opensearch dashboard-state index.
The state-archiver process is configured via a JSON file formatted as follows:
_ARCHIVER_CONFIG_SCHEMA
The archive element of the above configuration file must be formatted as follows:
STATE_RMQ_CONFIG
Execution
A state-archiver process is started by executing the state-archiver shell script:
Usage: state-archiver [OPTIONS]

Options:
  --config FILENAME  configuration filename  [required]
  --help             Show this message and exit.
Router Isolation Detector
To be implemented, but here’s the original design schematic:

Dashboard Health Check Web Service
This is a Flask Web Service that returns the health of the critical Dashboard microservices.
This data is used in the status panel in the GUI.
Dashboard Health Check API
API Endpoints
/version
- dashboard.health.routes.api.version()
Returns a json object with information about the module version.
The response will be formatted according to the following schema:
VERSION_SCHEMA{ "$schema": "https://json-schema.org/draft/2020-12/schema", "type": "object", "properties": { "api": { "type": "string", "pattern": "\\d+\\.\\d+" }, "module": { "type": "string", "pattern": "\\d+\\.\\d+" } }, "required": [ "api", "module" ], "additionalProperties": false }
- Returns:
version json structure
/health
- dashboard.health.routes.api.health()
Returns a json object with information about the module version.
The response will be formatted according to the following schema:
HEALTH_CHECK_RESPONSE_SCHEMA{ "$schema": "https://json-schema.org/draft/2020-12/schema", "definitions": { "process-status": { "type": "object", "properties": { "status": { "type": "string", "enum": [ "healthy", "warning", "error" ] }, "message": { "type": "string" }, "timestamp": { "type": "integer" } }, "required": [ "status", "message", "timestamp" ], "additionalProperties": false } }, "type": "object", "properties": { "correlator": { "$ref": "#/definitions/process-status" }, "classifier": { "$ref": "#/definitions/process-status" }, "collector": { "$ref": "#/definitions/process-status" }, "inventory": { "$ref": "#/definitions/process-status" } }, "required": [ "correlator", "classifier", "collector", "inventory" ], "additionalProperties": false }
- Returns:
health json structure
Low-Level Check Endpoints
These endpoints are only useful for debugging and development. They’re low-level access to calling the health check functions directly.
/inventory-provider
- dashboard.health.routes.check.inventory_provider()
Low-level endpoint for directly querying and returning inventory provider health.
Only intended for use during debugging/development.
/correlator
- dashboard.health.routes.check.correlator()
Low-level endpoint for directly querying and returning correlator health.
Only intended for use during debugging/development.
/classifier
- dashboard.health.routes.check.classifier()
Low-level endpoint for directly querying and returning classifier health.
Only intended for use during debugging/development.
/collector
- dashboard.health.routes.check.collector()
Low-level endpoint for directly querying and returning collector health.
Only intended for use during debugging/development.
Common Endpoint Support Utitily Functions
- dashboard.health.routes.common.after_request(rsp)
generic function to do additional logging of requests & responses :param response: :return:
- dashboard.health.routes.common.require_accepts_json(f)
used as a route handler decorator to return an error unless the request allows responses with type “application/json”
- Parameters:
f – the function to be decorated
- Returns:
the decorated function
RabbitMQ ping/pong utiltities
- dashboard.health.rmq.get_channel(rmq_params, exchange_name, exchange_type='direct')
Create a channel to the RabbitMQ server using the configured connection parameters.
- Parameters:
rmq_params – RabbitMQ connection parameters
exchange_name – Name of the exchange to use
exchange_type – Type of the exchange (default is ‘direct’)
- Returns:
A context manager that yields the channel
- dashboard.health.rmq.get(channel, queue, schema, timeout=2, stop_event=None)
Consume messages from a RabbitMQ queue and yields any that can be decoded and match the provide json schema.
- Parameters:
channel – RabbitMQ channel to consume from
queue – Name of the queue to consume from
schema – JSON schema to validate messages against
timeout – Timeout for consuming messages (default is 2 seconds)
stop_event – Optional threading event to signal stopping the consumer (used only for testing)
- Returns:
Yields messages that match the schema
- dashboard.health.rmq._ping_pongs(channel, exchange, proc_type, schema, stop_event=None)
Send a PING message to the specified exchange and yield all PONG responses that match the provided JSON schema.
- Parameters:
channel – RabbitMQ channel to use for publishing and consuming
exchange – Name of the exchange to broadcast to
proc_type – Type of process to ping (correlator, classifier, collector)
schema – JSON schema to validate PONG responses against
stop_event – Optional threading event to signal stopping the consumer (used only for testing)
- Returns:
Yields all PONG responses that match the schema
- dashboard.health.rmq.ping_proc_type(rmq_params, proc_type, schema, stop_event=None)
Creates a RabbitMQ channel and uses it to call _ping_pongs and return all matching PONG responses.
- Parameters:
rmq_params – RabbitMQ connection parameters
proc_type – Type of process to ping (correlator, classifier, collector)
schema – JSON schema to validate PONG responses against
stop_event – Optional threading event to signal stopping the consumer (used only for testing)
- Returns:
Yields all PONG responses that match the schema
Service Status Query utilities
- dashboard.health.status.load_inventory_health(app_config)
picks a random endpoint from the configured inventory-version-uris list and queries the version endpoint
the health will indicate error if the version response reports an error condition or if the latest update has been pending for longer than the configured inventory_pending_error_threshold_s
the health status is set to warning if an update is in progress
- Parameters:
app_config – the application config
- Returns:
the health status of the inventory provider service
- dashboard.health.status.load_correlator_health(app_config, stop_event=None)
pings all correlators and finds the leader. An error is returned if there’s no leader node found. _init_timestamp_health is then used to set the health of the service.
- Parameters:
app_config – the application config
stop_event – the event to stop the consume loop (only used in tests)
- Returns:
the health status of the correlator service
- dashboard.health.status.load_classifier_health(app_config, stop_event=None)
pings all classifiers and uses _init_timestamp_health to set the health of the service. the status can also be set to WARNING if the number of classifiers is less than the configured expected_num_classifier_nodes
- Parameters:
app_config – the application config
stop_event – the event to stop the consume loop (only used in tests)
- Returns:
the health status of the overall classifier service
- dashboard.health.status.load_collector_health(app_config, stop_event=None)
pings all collectors and uses _init_timestamp_health to set the health of the service
- Parameters:
app_config – the application config
stop_event – the event to stop the consume loop (only used in tests)
- Returns:
the health status of the overall collector service
- dashboard.health.status._init_timestamp_health(thresholds, last_trap_ts)
compares last_trap_ts with the configured threshholds of trap_health_error_threshold_s and trap_health_warning_threshold_s. Returns a ProcessStatus object with the appropriate status and message.
- Parameters:
thresholds – the configured health check thresholds
last_trap_ts – the last trap timestamp
- Returns:
the health status of the service
App Environment Setup
- dashboard.health.environment.setup_logging()
set up logging using the configured filename
- if LOGGING_CONFIG is defined in the environment, use the contents
as the logging configuration, otherwise use _LOGGING_DEFAULT_CONFIG
- dashboard.health.environment.setup_sentry(sentry_config)
set up sentry instrumentation
- Parameters:
sentry_config – the app config ‘sentry’ element
Heartbeat Messages
Heartbeat messages (not to be confused with heartbeats from any other part of dashboard) are sent at regular intervals into the exchange preceding classifier. Heartbeats do nothing except update the ‘last-received-ts’ counter which keeps watchdog from being triggered when there aren’t many traps coming in. These heartbeats mostly follow the same route that trap data takes, into classifier, then passed to correlator, then to the notification exchange. Finally, the Elasticsearch archiver archives heartbeats alongside other notifications. All other notifiers consume but do nothing with heartbeats. As of writing these currently are:
Argus notifier
OTRS notifier
Slack notifier
TTS notifier
Heartbeat data flow:

AMT Isolation
This package provides tools and listeners for monitoring and managing the isolation state of AMT routers.
Processes in this package listen for relevant network events, evaluate AMT router status, and broadcast isolation state messages via RabbitMQ.
This section documents the amt-isolation-checker command-line tool.
Command-Line Interface
amt-isolation-checker
Usage
amt-isolation-checker [OPTIONS]
Options
- --hostname <hostname>
RabbitMQ hostname [‘test-noc-alarms01.geant.org’, ‘test-noc-alarms02.geant.org’, ‘test-noc-alarms03.geant.org’]
- --monitoring <monitoring>
monitoring requests exchange name [mon.requests]
- --broker-exchange <broker_exchange>
alarm state broadcast exchange name [dashboard.alarms.broadcast]
- --broker-queue <broker_queue>
amt isolation queue name [dashboard.amt_isolation]
- --broadcast <broadcast>
isolation state broadcast exchange name [dashboard.deduplicated]
- --username <username>
RabbitMQ username [dashboard]
- --password <password>
RabbitMQ user password [password]
- --vhost <vhost>
RabbitMQ vhost [/dashboard]
- --watchdog <watchdog>
watchdog check frequency in seconds (no watchdog if unset)
- --timeout <timeout>
number of seconds without correlator state messages to indicate error [240]
- --timeout_reconnect, --no-timeout_reconnect
reconnect to rmq if no traps received in ‘timeout’ seconds [True]
- --inventory <inventory>
Inventory Provider base uris [’https://test-inprov01.geant.org/’, ‘https://test-inprov02.geant.org/’, ‘https://test-inprov03.geant.org/’]
- --inventory_token <inventory_token>
API Token for accessing the Inventory Provider service [default is None]
- --sentry-dsn <sentry_dsn>
Sentry DSN
- --sentry-environment <sentry_environment>
Sentry environment
Data Flow

Private and IX Public Peering monitoring
Processes in this package listen to the correlator state broadcast and publish messages about IXP reachability and Peering provider status.
IXP Reachability Checker
ixp-reachability-checker
Consumes correlator state messages and checks for IXP reachability.
An IXP is considered reachable if the Link endpoint for the router and that location is up and if the peering for >50% of the public peers for that IXP are up.
The IXP reachability status is published to the classifier.
Usage
ixp-reachability-checker [OPTIONS]
Options
- --hostname <hostname>
RabbitMQ hostname [‘test-noc-alarms01.geant.org’, ‘test-noc-alarms02.geant.org’, ‘test-noc-alarms03.geant.org’]
- --monitoring <monitoring>
monitoring requests exchange name [mon.requests]
- --broker-exchange <broker_exchange>
alarm state broadcast exchange name [dashboard.alarms.broadcast]
- --broker-queue <broker_queue>
IXP listener queue name [dashboard.ix]
- --broadcast <broadcast>
outbound message exchange name [dashboard.deduplicated]
- --username <username>
RabbitMQ username [dashboard]
- --password <password>
RabbitMQ user password [password]
- --vhost <vhost>
RabbitMQ vhost [/dashboard]
- --watchdog <watchdog>
watchdog check frequency in seconds (no watchdog if unset)
- --timeout <timeout>
number of seconds without correlator state messages to indicate error [240]
- --timeout_reconnect, --no-timeout_reconnect
reconnect to rmq if no state received in ‘timeout’ seconds [True]
- --inventory <inventory>
Inventory Provider base uris [’https://test-inprov01.geant.org/’, ‘https://test-inprov02.geant.org/’, ‘https://test-inprov03.geant.org/’]
- --inventory_token <inventory_token>
API Token for accessing the Inventory Provider service [default is None]
- --sentry-dsn <sentry_dsn>
Sentry DSN
- --sentry-environment <sentry_environment>
Sentry environment
IX Group Listener
ix-group-listener
Consumes correlator state messages and publishes per-ASN IX group reachability.
All pub/priv peerings are fetched from inventory-provider and grouped by ASN. Each group is considered up if any individual peering in the group is up. One ix-group message is published per ASN group.
Usage
ix-group-listener [OPTIONS]
Options
- --hostname <hostname>
RabbitMQ hostname [‘test-noc-alarms01.geant.org’, ‘test-noc-alarms02.geant.org’, ‘test-noc-alarms03.geant.org’]
- --monitoring <monitoring>
monitoring requests exchange name [mon.requests]
- --broker-exchange <broker_exchange>
alarm state broadcast exchange name [dashboard.alarms.broadcast]
- --broker-queue <broker_queue>
IX group listener queue name [dashboard.ix.groups]
- --broadcast <broadcast>
outbound message exchange name [dashboard.deduplicated]
- --username <username>
RabbitMQ username [dashboard]
- --password <password>
RabbitMQ user password [password]
- --vhost <vhost>
RabbitMQ vhost [/dashboard]
- --watchdog <watchdog>
watchdog check frequency in seconds (no watchdog if unset)
- --timeout <timeout>
number of seconds without correlator state messages to indicate error [240]
- --timeout_reconnect, --no-timeout_reconnect
reconnect to rmq if no state received in ‘timeout’ seconds [True]
- --inventory <inventory>
Inventory Provider base uris [’https://test-inprov01.geant.org/’, ‘https://test-inprov02.geant.org/’, ‘https://test-inprov03.geant.org/’]
- --inventory_token <inventory_token>
API Token for accessing the Inventory Provider service [default is None]
- --sentry-dsn <sentry_dsn>
Sentry DSN
- --sentry-environment <sentry_environment>
Sentry environment